

What is Grafana?
Grafana is a versatile open-source platform used to create interactive and real-time dashboards for visualizing data from various sources. It's commonly employed for monitoring and analyzing systems, applications, and business metrics, offering flexible visualizations, alerting capabilities, and integration with diverse data repositories.
Uses of Grafana
Monitoring: Tracking system, application, and infrastructure metrics in real time.
Analysis: Examining time-series data trends and anomalies.
Visualization: Creating interactive dashboards to display data insights.
Alerting: Notifying about threshold breaches and critical events.
Business Intelligence: Displaying KPIs and business metrics.
IoT Monitoring: Monitoring Internet of Things devices and sensors.
DevOps and SRE: Optimizing deployments and ensuring reliability.
Cloud Monitoring: Monitoring cloud resources and services.
Log Analysis: Analyzing application and system logs.
Security Monitoring: Visualizing security events and network traffic.
It's a versatile tool with applications in various industries.
Why we need Monitoring
Detects issues early, preventing downtime.
Optimizes processes and resource usage.
Enhances security and compliance.
Measures performance and user experience.
Enables predictive analysis and planning.
Ensures business continuity and efficiency.
Grafana Installation Steps
Let's move to the AWS console and create an EC2 instance.
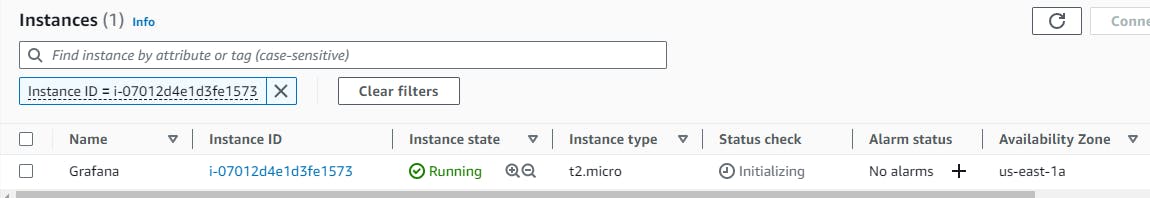
Grafana runs on port 3000, so make sure to enable the port in the "Security Group" of the EC2 instance.
Connect to the EC2 instance using SSH-client and start installing the Grafana link
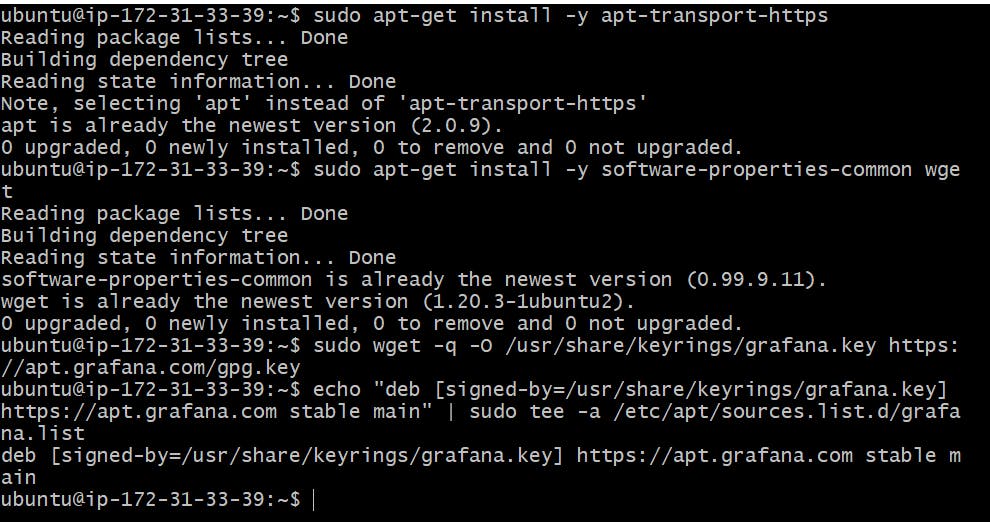
To install the required packages and download the Grafana repository signing key, run the following commands:
sudo apt-get install -y apt-transport-https
sudo apt-get install -y software-properties-common wget
sudo wget -q -O /usr/share/keyrings/grafana.key https://apt.grafana.com/gpg.key
To add a repository for stable releases, run the following command:
echo "deb [signed-by=/usr/share/keyrings/grafana.key] https://apt.grafana.com stable main" | sudo tee -a /etc/apt/sources.list.d/grafana.list
Update the list of packages
sudo apt-get update
To install Grafana OSS, run the following command:
sudo apt-get install grafana -y
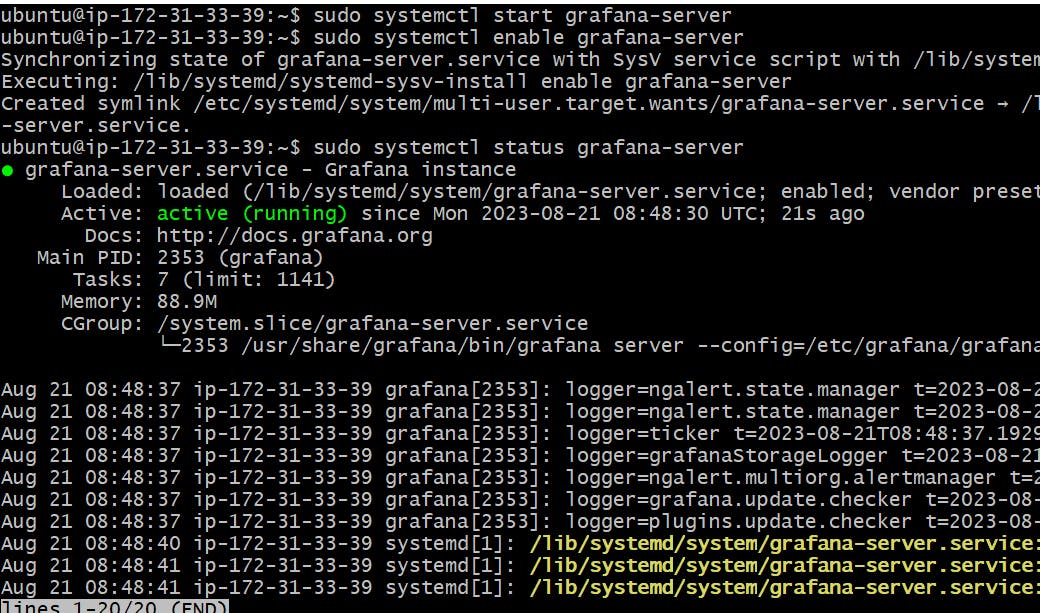
Once the Grafana is installed on EC2, use the below commands to check the status
sudo systemctl start grafana-server
sudo systemctl enable grafana-server
sudo systemctl status grafana-server
Access the Grafana by using <EC2PublicIP:3000>
Username= admin/Password= admin
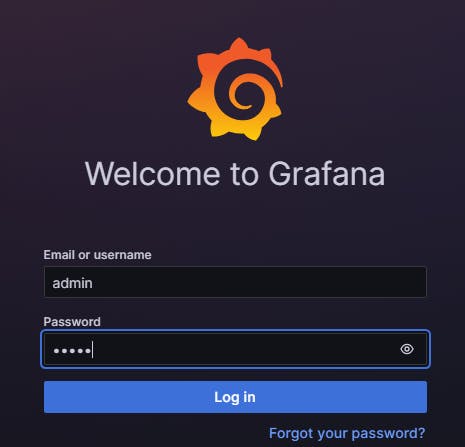
Change the Password after the first login
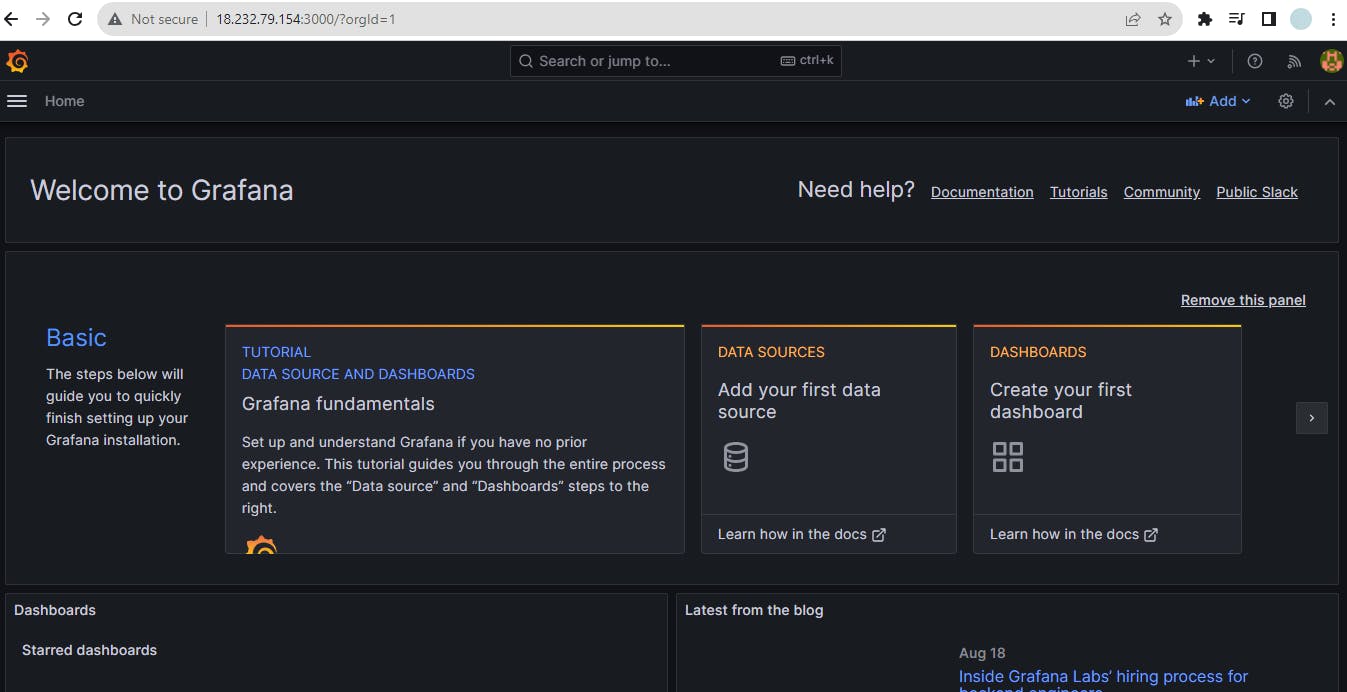
That's it we have successfully installed Grafana on our EC2 instance.
To stop Grafana Server
sudo systemctl stop grafana-server
Grafana Loki
Grafana Loki is a set of components that can be composed into a fully featured logging stack.
Unlike other logging systems, Loki is built around the idea of only indexing metadata about your logs: labels (just like Prometheus labels). Log data itself is then compressed and stored in chunks in object stores such as S3 or GCS, or even locally on the filesystem. A small index and highly compressed chunks simplify the operation and significantly lower the cost of Loki.
Install Grafana Loki with Docker or Docker Compose
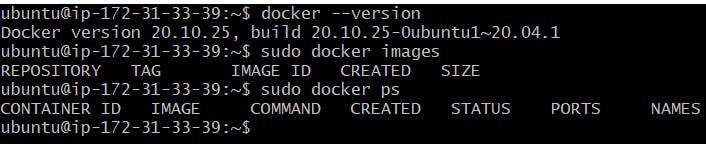
Prerequisites
sudo apt-get install docker.io -y
sudo usermod -aG $USER
sudo reboot
Copy and paste the commands below into your command line to install Loki and Promtail
wget https://raw.githubusercontent.com/grafana/loki/v2.8.0/cmd/loki/loki-local-config.yaml -O loki-config.yaml
sudo docker run --name loki -d -v $(pwd):/mnt/config -p 3100:3100 grafana/loki:2.8.0 -config.file=/mnt/config/loki-config.yaml
wget https://raw.githubusercontent.com/grafana/loki/v2.8.0/clients/cmd/promtail/promtail-docker-config.yaml -O promtail-config.yaml
sudo docker run --name promtail -d -v $(pwd):/mnt/config -v /var/log:/var/log --link loki grafana/promtail:2.8.0 -config.file=/mnt/config/promtail-config.yaml
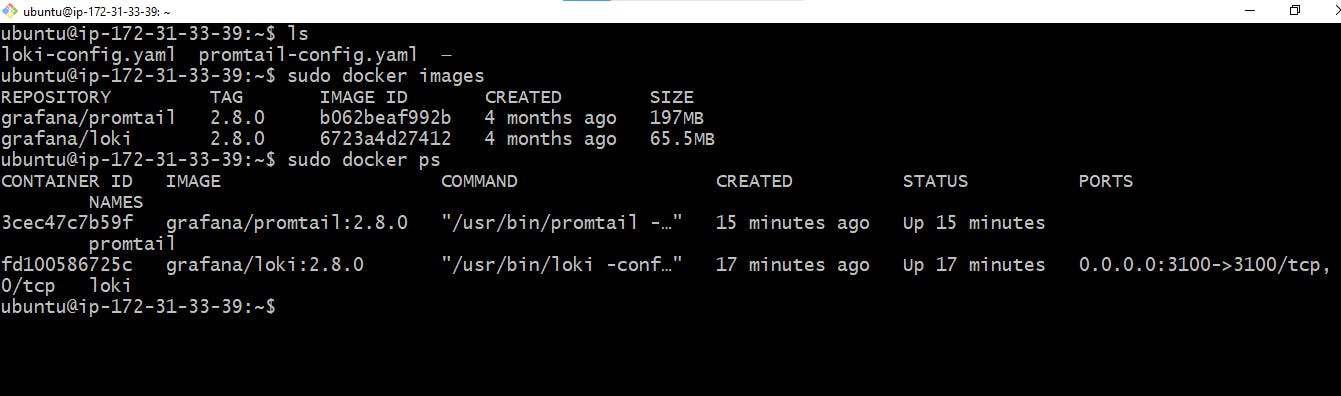
Once you run these Loki and Pomtail commands, config files for Loki and Promtail will be created in the EC2 instance with docker images and container
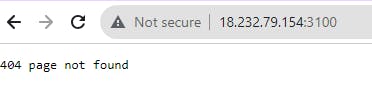
Access the Loki using <EC2PublicIP:3100>, it throws an error 404 page not found
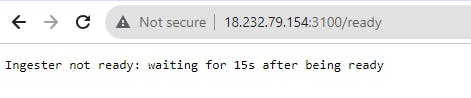
To overcome this issue add /ready at the end of the IP address like the image below and refresh until it is shown as ready
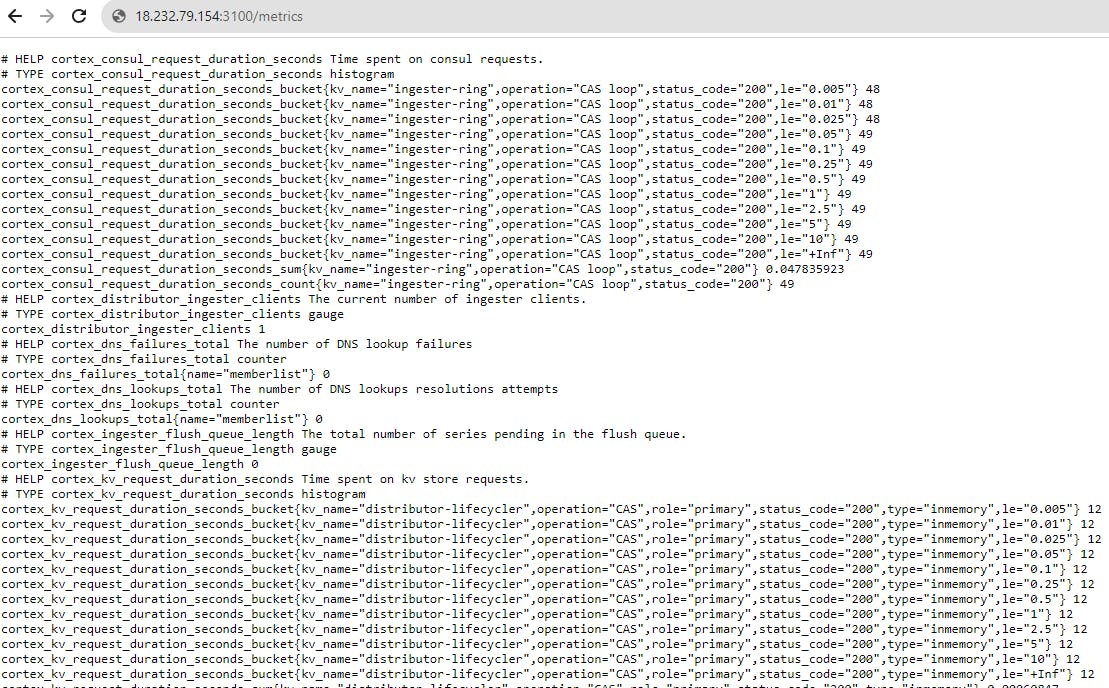
IP/metrics
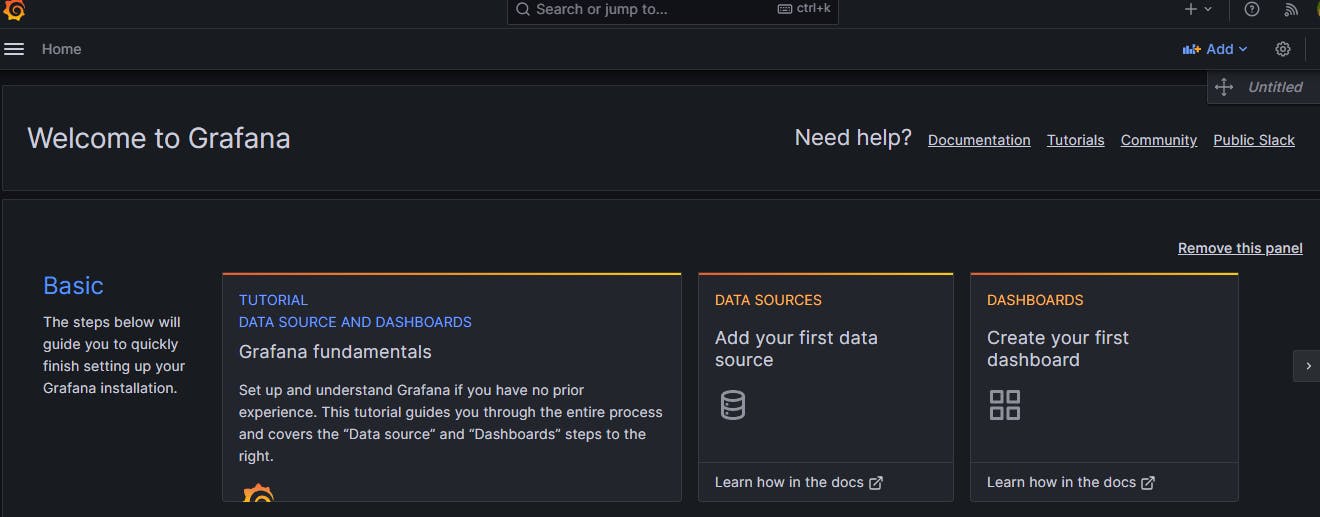
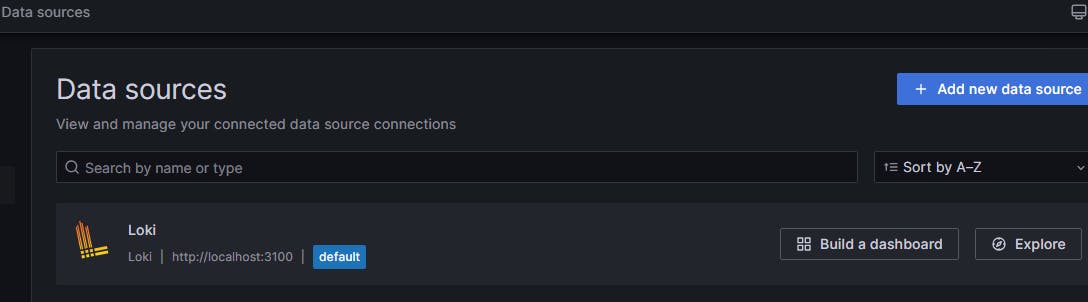
Now Let's move to Grafana Home Page and click on Data sources
Search for Loki
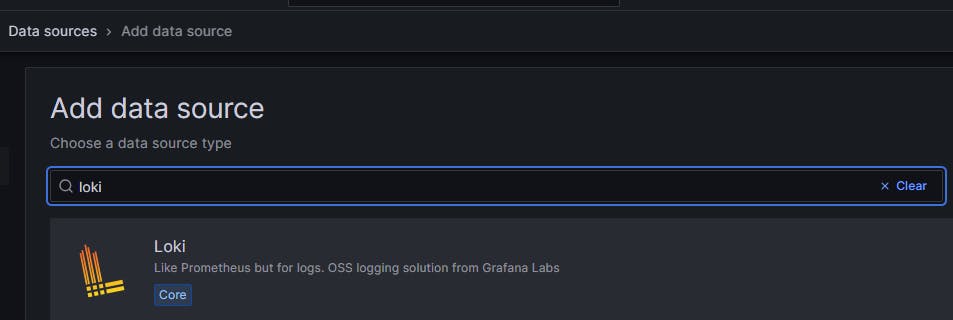
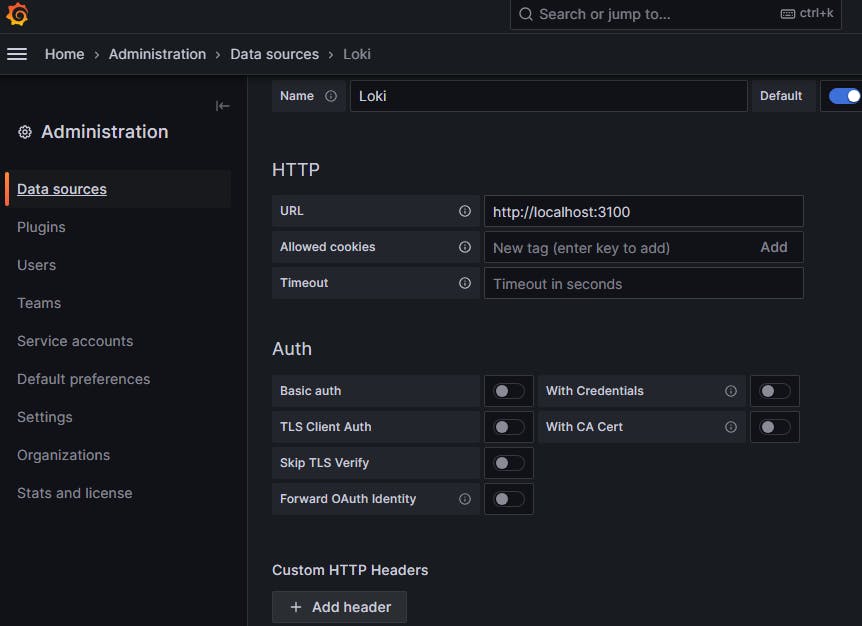
Setup Loki now
URL should be locahost:3100 but not EC2PublicIP:3100 (Not recommended)
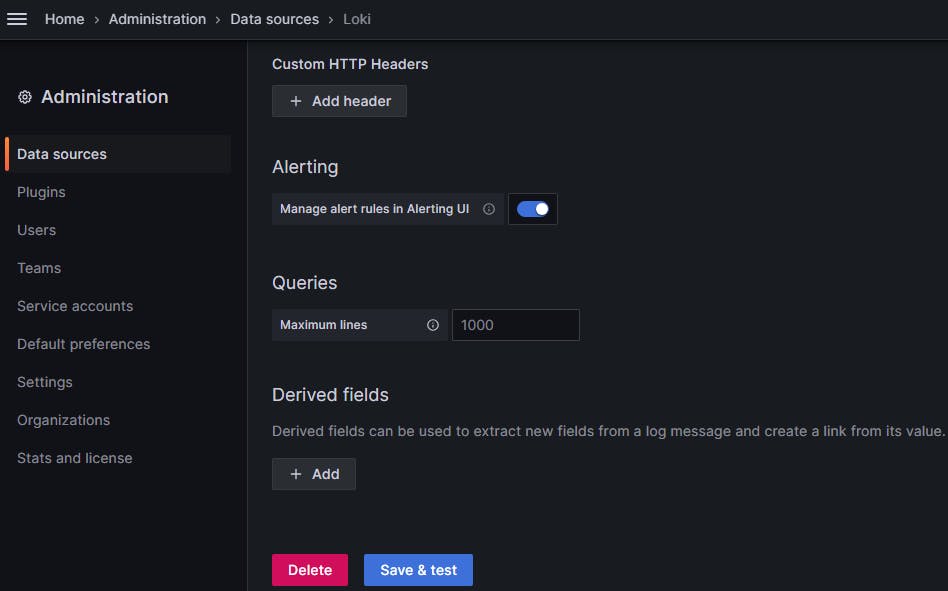
Click on save & test and
Now we will check the logs for the system, promtail will bring all the logs from different sources and Grafana Loki stores it and then give it to Grafana so that we can visualize and create a dashboard from it.
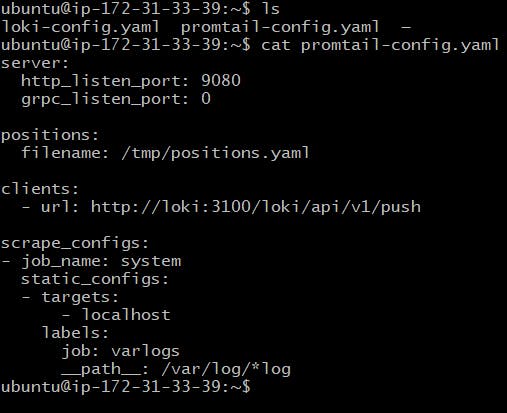
If you check the promtail.config.yaml, the target for logs is localhost
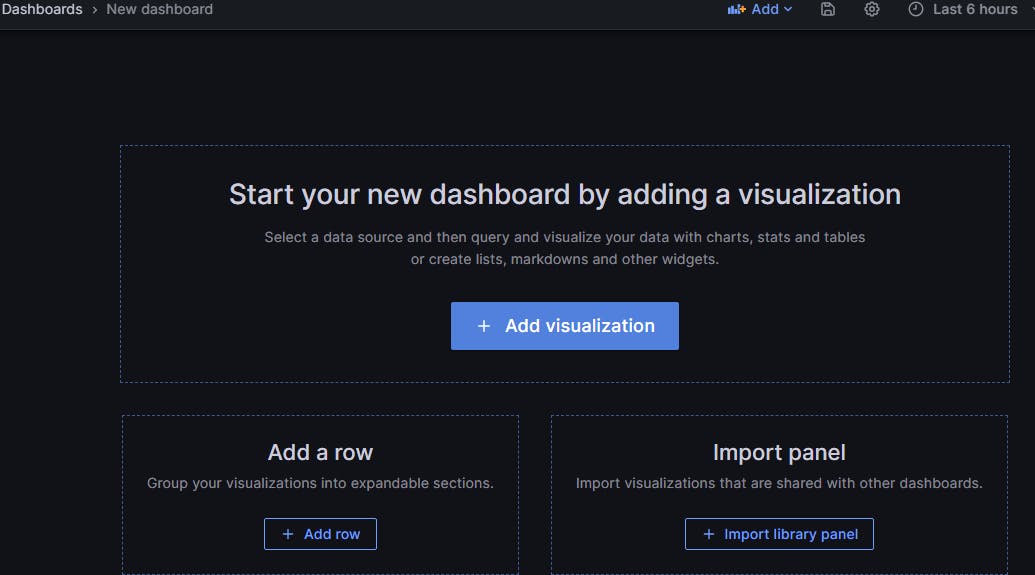
Now click on Build a dashboard or on Explore
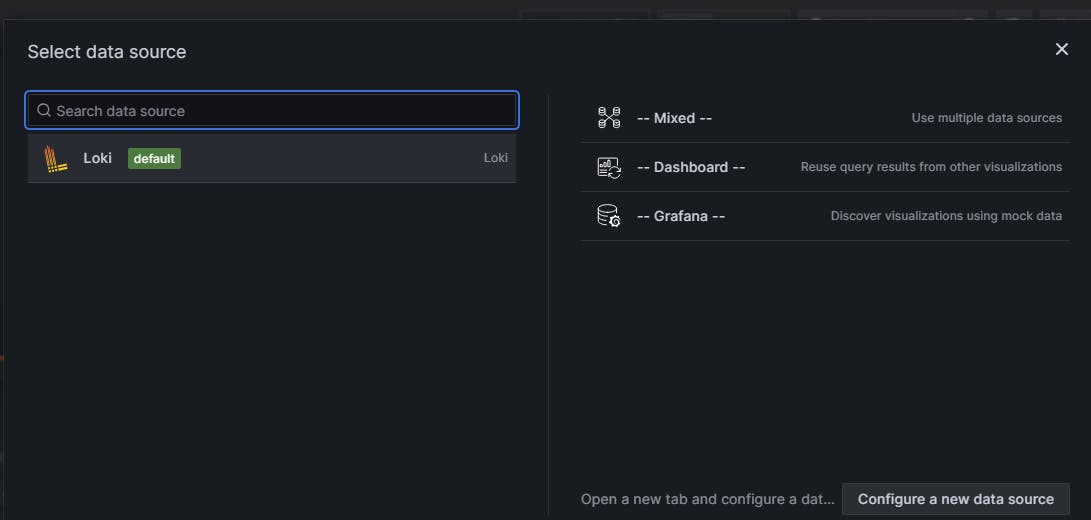
Click on + Add visualization
Select Loki
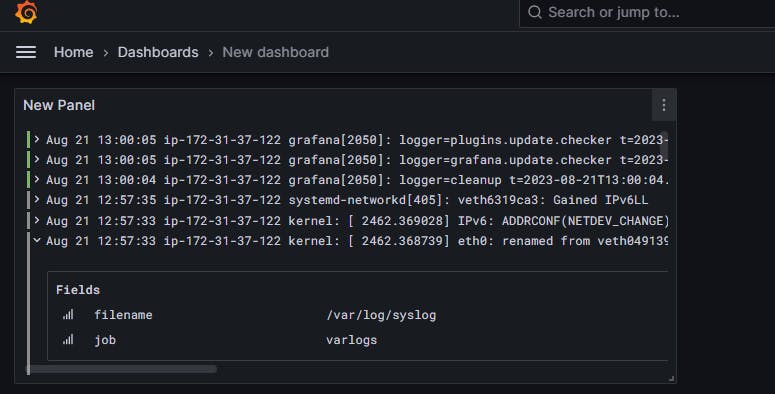
We have entered in the dashboard panel
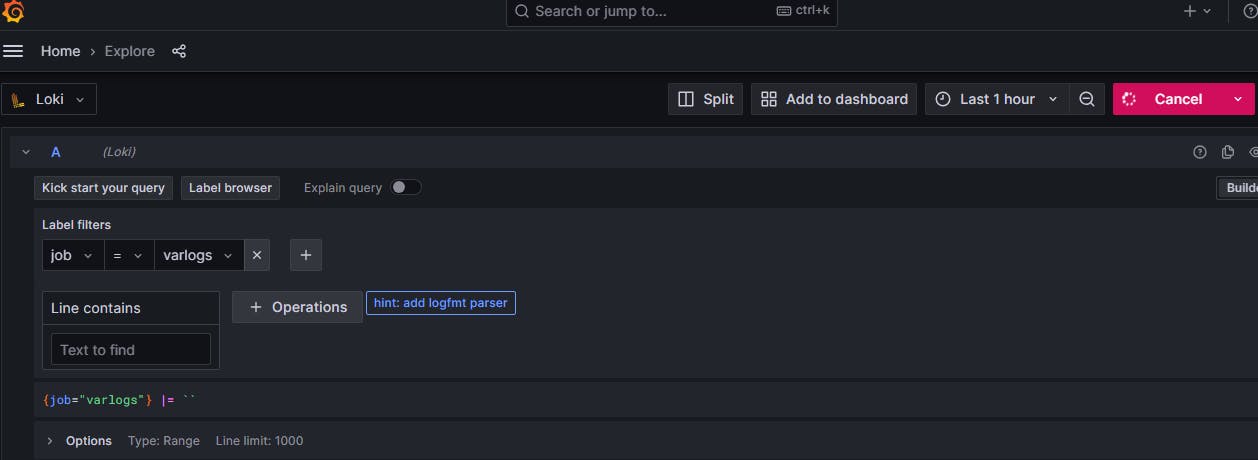
Select the filter labels as Job = varlogs and click on Run query.
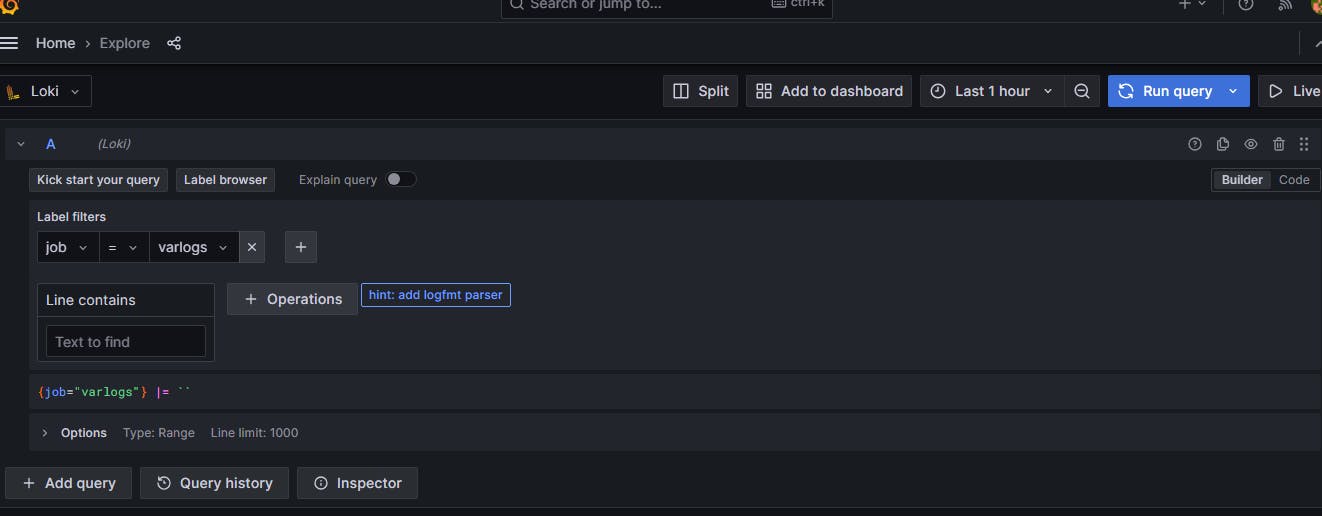
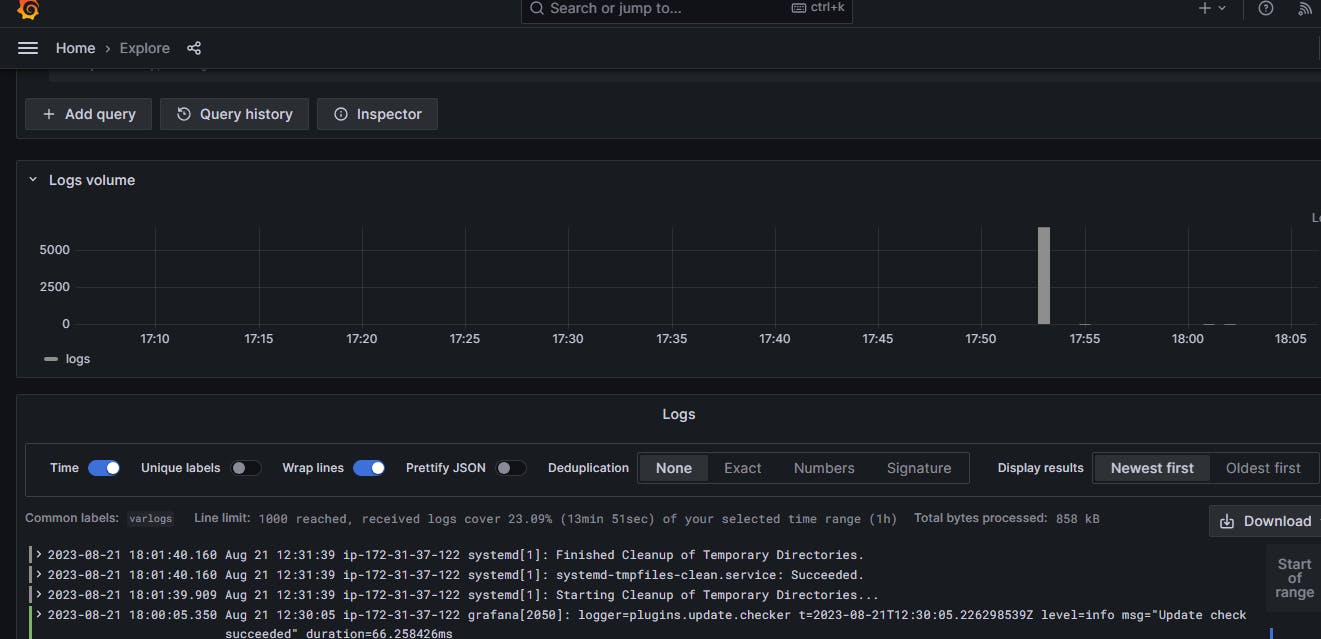
Scroll down to view the logs rolling
We can also check the Grafana internal logs in the terminal present in the directory by using Loki
sudo cat /var/log/grafana/grafana.log
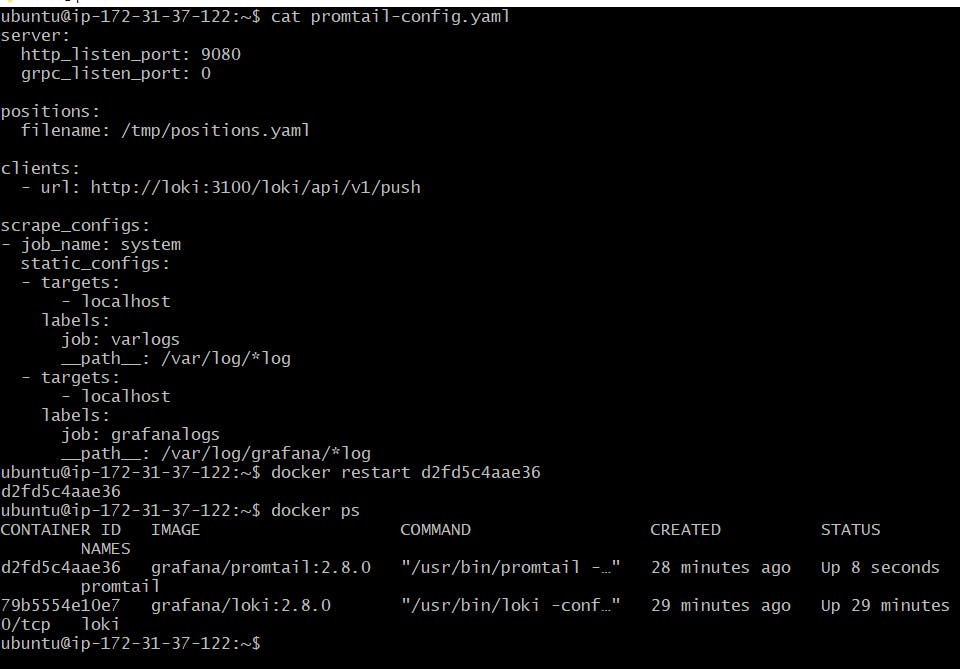
nano promtail-config.yaml
Add a new target as labels for Grafana internal logs
Restart the promtail docker container to apply new target changes
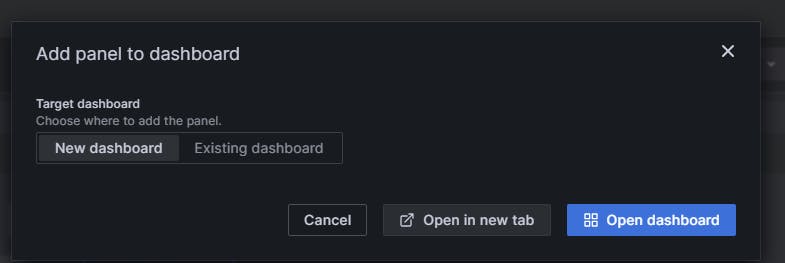
Once you generate logs click on Add to Dashboard
Open the dashboard
Now go to the instance and install anything like Nginx
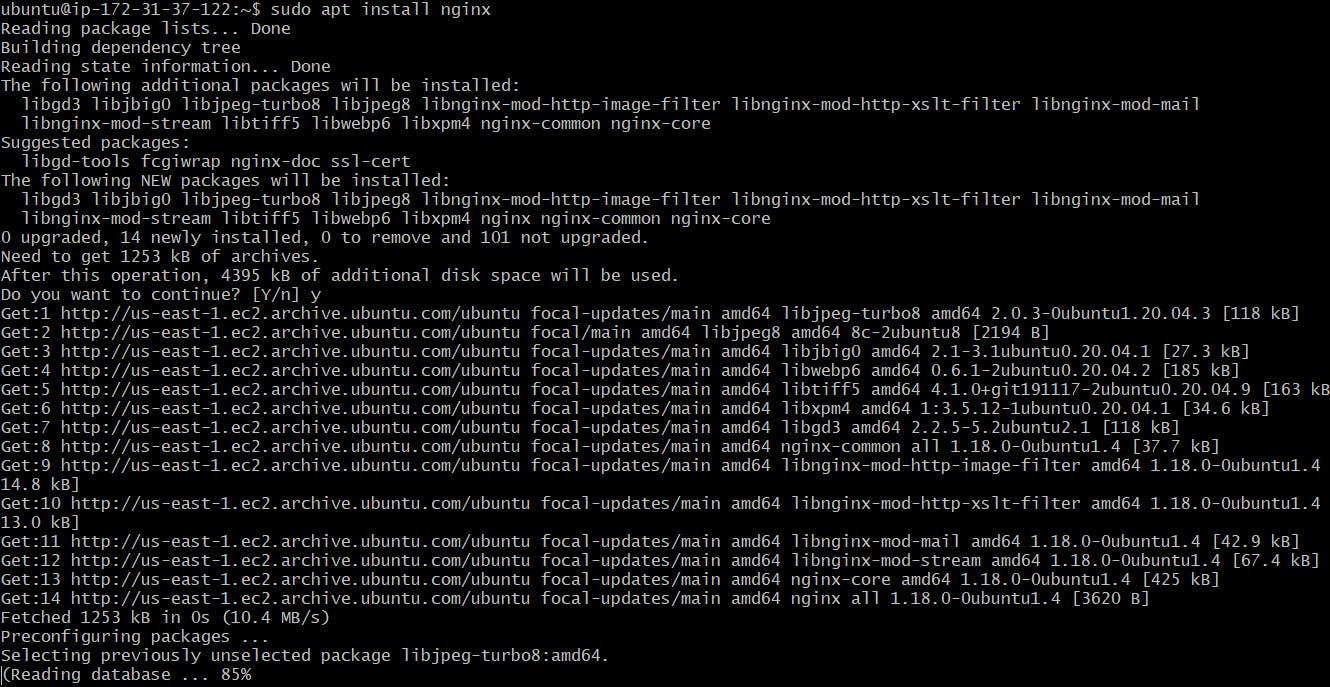
Let's generate all the logs of nginx in Grafana
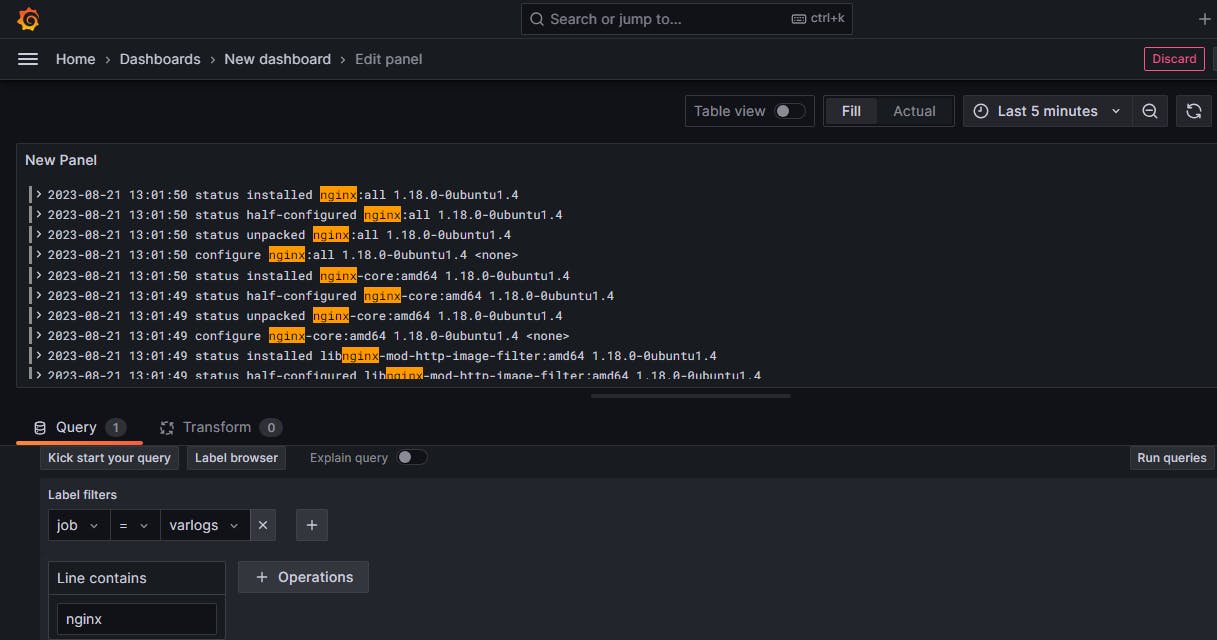
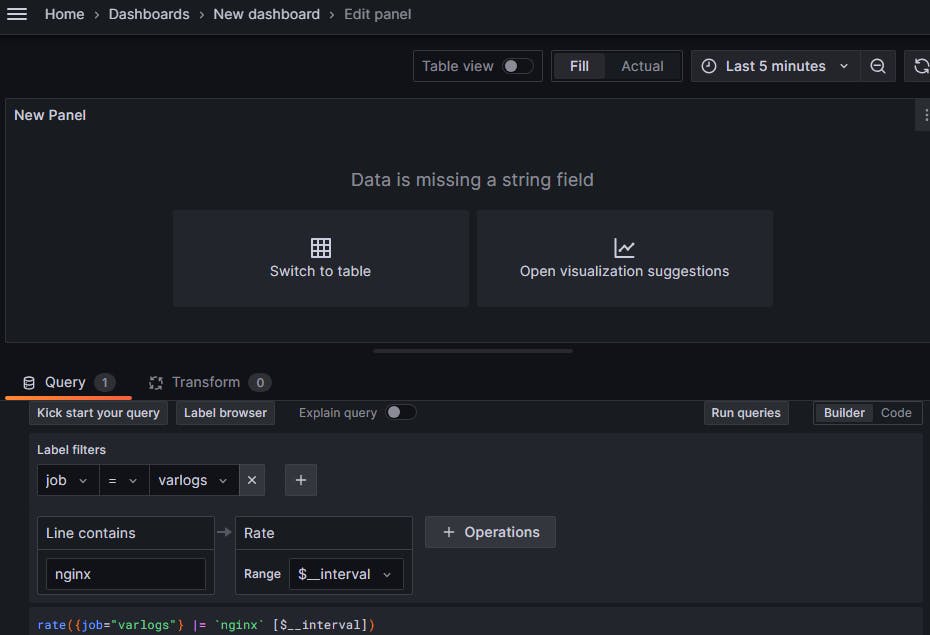
Click on Open Visualization
Type nginx in the line containing and run queries to check the ngix logs
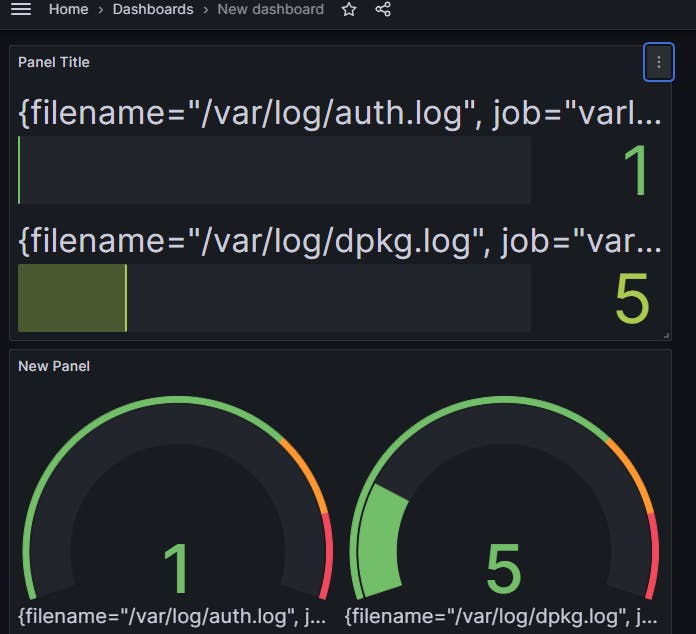
Save and apply the dashboard